Delaware’s 2015 NAEP Results: 5 Data Takeaways
Last week, the country received some not-so-great news as state scores on the National Assessment of Education Progress (NAEP) went down or remained flat. Similarly, Delaware scores and proficiency slipped. We took a slightly deeper look at the data, and rostered our 5 Data Takeaway’s from Delaware 2015 NAEP results.
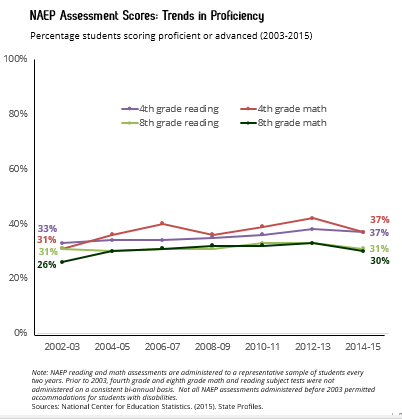
1. Delaware scores and proficiency slipped from 2013 to 2015, but have generally improved since 2003. Since 2003, Delaware proficiency has increased across nearly all grades and subjects (see graph). Since 2003, average scores increased in math, but slipped or remained flat in reading.
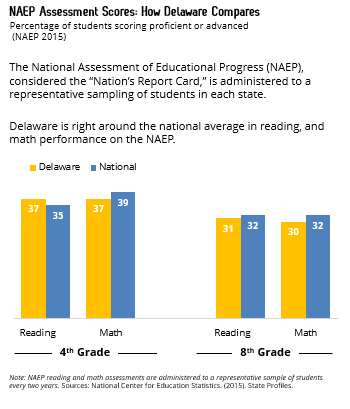
2. And Delaware continues to perform above or on par with the national average proficiency (see graph) and average score. Delaware’s average score is higher than the national average in fourth grade reading, and not statistically different from the national average in fourth grade math, eighth grade reading, and eighth grade math.
3. Delaware higher-income students are being out-performed by peers in other states. According to EdTrust’s analysis and data tables of 2015 NAEP scores, the average score for Delaware higher-income students falls below the national average score for higher-income students. Furthermore, when ranked against others states according to the average scores of higher-income students, Delaware falls into the bottom quartile.
4. Conversely, Delaware low-income, black, and Hispanic students perform above or on-par with their peer populations in other states. According to EdTrust’s analysis and data tables of 2015 NAEP scores, the average score for Delaware low-income students is above or on-par with the national average score for low-income students. This also holds true for black and Hispanic student populations.
5. Unfortunately, score gaps persist in Delaware. Black, Hispanic, and low-income students continue to perform approximately 15-26 points below their white or higher-income peers. The score gap in math is not (statistically) significantly different from that in 2003, and the score gap in reading is not (statistically) significantly different from that in 1998.
It’s difficult to judge the impact of current education policies and initiatives on this year’s NAEP results, so we’re waiting on further data and research findings before drawing conclusions. We know that Delaware educators are hard at work implementing higher standards in the classroom and many other initiatives are underway to help students achieve success. We’ve also been hearing that demographic shifts or changes in special education participation/data reporting may have impacted 2015 performance. However, there are many factors and unknown variables that may (or may not) have contributed to this year’s slip in assessment scores.
Related Topics: assessment, Delaware, NAEP, testing